The clincher was Friday’s BES face-to-face release, a post-election survey that was fielded between May and September by GfK-NOP. The reason why this survey is so significant is that unlike every normal national poll, it’s a genuine probability sample – they randomly selected names from the Postcode Address File and then went to enormous lengths, spending several months and a staggering amount of money to contact that individual, achieving a response rate of 56%, compared with single digits for typical phone polls.
As a result, it was the one poll that got the national vote shares (and Tory lead) about right. The broadcasters’ exit poll was also a virtual bullseye, and was a also probability survey with a very high response rate done in part by GfK-NOP (who, it’s fair to say, are having rather a good year) but that poll was only conducted in marginal seats, rather than the whole of England, Scotland and Wales. If we reweight the new BES data to match the 2010 and 2015 vote shares exactly, we get the following crosstabs:

This shows a very similar movement of votes between the smaller and larger parties to the relative net flow analysis. Note that due to the fact that the BES data doesn’t quite match either election result perfectly, the reweighting I’ve done changes the figures sightly (for example, the highlighted Lib Dem switcher percentages change to 19% and 26% from original figures of 20% and 25%).
For comparison, here is the same crosstab from BES online panel (without reweighting):

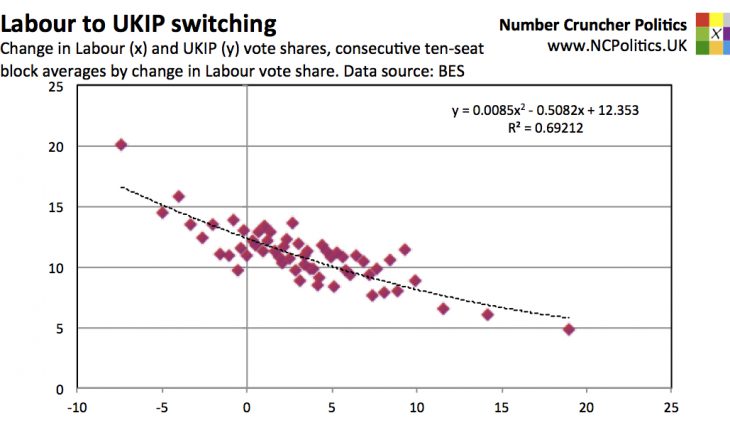
All of this data corresponds to how people voted in 2010, which is important because polls are usually weighted by past vote. But given what we know about the history of UKIP voters that voted Conservative in 2010 (to summarise: many of them had previously voted Labour), it is likely that over the last two election cycles, UKIP has taken more voters from Labour than from the Conservatives (or any other party).
These flows of voters also explain why polls in Scotland were so much more accurate than Great-Britain wide polls. UKIP gained less than a point, while the 2010 Lib Dem vote went predominantly to the SNP, (and the former’s collapse pre-dated the 2011 Holyrood elections anyway) making everything a lot simpler. Similarly in London, UKIP put in its worst performance anywhere in England and Wales, while 2010 Lib Dem Londoners actually did go heavily to Labour, unlike the rest of the South, but very much as London-only polls had suggested.
In Scotland pollsters had a further advantage – the 2014 independence referendum split Scottish voters roughly 5-to-4 in favour of no. It may have been divisive among Scots, but Indyref was (and remains) extremely useful as a variable to weight by.
Polls had also suggested that the direct flows between Labour and the Conservatives were very small and essentially cancelled each other out. They were indeed very small, so small in fact that it’s impossible to use the relative net flow model reliably. But the new BES data suggests that there was in fact a slight net impact, and it went in the Tories’ favour.

Click to enlarge
This set of errors was reflected in some of the polling data besides topline voting intention. Those that voted Conservative in 2015 appear to have been far more socially liberal than was previously thought. The BES face-to-face wave found that 37% of 2015 Tory voted felt that gender equality had either “not gone far enough” or “not gone nearly far enough”, compared with 26% in the final online wave. 26% in the probability survey felt that racial equality needed to go further, versus only 9% of the online panel. While there were also higher numbers for supporters of other parties (perhaps indicating an interviewer effect), the differences were proportionately far smaller.
The new Conservative coalition was also better qualified and more gender balanced than anyone realised. In fact the new BES data suggests that the Tories had both a larger vote share and a three-point larger lead among women than among men. The latter finding may be related to the age composition – older women are more Conservative than older men (among younger generations the reverse is the case) so an older-than-anticipiated voting population would have affected the overall gender pattern.
These numbers support the theory that Conservative modernisation helped – not hurt – the Tory performance in 2015, as Daniel Finkelstein argues in today’s Times, citing this analysis. It very likely made the difference between winning a majority and falling short.
So the polls, like the pundits, misread who was doing what. The collapse of the Lib Dems brought a large number of “small l” liberals into play and the Tories won a substantial share of them, without losing out substantially more than Labour from the “small c” conservatives heading off to UKIP. The whole idea of a split on the right and a reunification on the left was simply wrong. Prior to the coalition the two big parties had a fair few socially conservative voters and the third party was a socially liberal one. The great realignment then happened, and we ended up with main parties taking an increasingly liberal stance on social issues while socially conservative UKIP emerged as the third party in terms of votes.
As in many other countries, it now seems the revolt on the right hurt the centre-left the most. I would strongly recommend re-reading Rob Ford and Matthew Goodwin’s book of that name with a fresh pair of eyes, rather than through the prism of “yes, but the polls say…” Also worth reading is Revolt on the Left, a paper by Marcus Roberts featuring Rob Ford and Ian Warren for the Fabian Society on the UKIP threat to Labour.
(Continued, please navigate using numbered tabs…)

