After much hype, the YouGov/QMUL poll landed almost exactly where recent movements in national polls suggested it would, with Labour 22 points ahead (51-29) of the Conservatives in London local election voting intention.
This led to much debate about the expectations game, with both left and right agreeing that expectations are very high for Labour and low for the Tories.
Personally I don’t like this “spin war”, partly because one or both sides end up talking psephological nonsense, but also because performance relative to expectations isn’t a great way to measure performance. If a party does better or worse than expected, it can often be the case the expectations were simply wrong, for example due to inaccurate polling, or whatever.
Expectations for London are being revised following the poll, but what about a benchmark? How would Labour winning by 22 points (see below for caveats on polling accuracy) actually compare historically?
In absolute terms, as everyone has been saying, this would be an extremely strong performance for Labour – the first absolute majority of the popular vote since 1971 and the biggest margin of victory since the Conservative landslide of 1968. Tory councils that were out of reach even for New Labour in its heyday could turn red.
That said, Labour doing extremely well in London isn’t new news. A substantial swing towards Jeremy Corbyn’s London councillors is almost certain, but since these seats were last contested in 2014 there have been two general elections, with a London swing of just over 6 per cent between them, and local election results have to catch up with this. And then we can start talking about the mid term progress that opposition parties usually make.
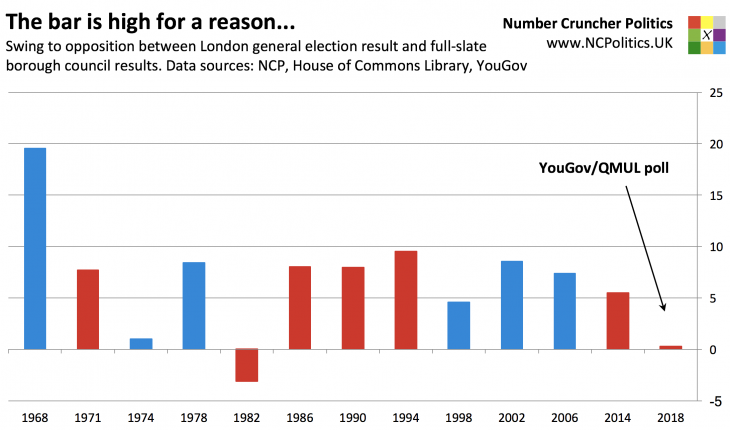
To see how the poll – if borne out by the result – looks historically, I’ve taken the results of previous London borough elections that weren’t on the same day as a general election (in other words, all except 2010) and compared them to the previous general election result in London. So, for example, in 1990 Labour won in London by about a point (using the full slate method), having lost London at the 1987 general election by 15 points, making an 8 per cent swing between the two.

Labour’s 22-point poll lead represents a swing of 0.3 per cent from its 21.4 point winning margin in London last June. So if you benchmark to the last general election, as the BBC’s projected national share measure will next week, and in doing so take into account the massive divergence in voting habits between London (and some other urban areas) and the rest of the country, these figures are a lot better for the Conservatives and less good for Labour than it might appear at first glance.
In fact the only time an opposition has made less progress was during the Falklands war in 1982, when Michael Foot lost ground compared with 1979.
Whenever I’ve made points along these lines, someone invariably replies with “yes, but local elections are low turnout and Labour voters will stay home”. The problem with this theory is that there’s literally no evidence to back it up. It’s true that Labour voters are typically from lower turnout demographics than Tory voters. But that doesn’t mean that the difference between their respective turnout rates ought to widen simply because overall turnout is lower. If it did, then swings to Tory oppositions in the chart above ought to be bigger than to Labour oppositions, but the median for both parties is about 8 per cent.
For a Labour take on how things are actually going, Sienna Rodgers has written this for LabourList. Phil Cowley’s writeup in the Standard is worth a read and the latest Polling Matters with Colin Rallings is worth a listen as always.
Expectations versus benchmarks
|
27th April 2018 |
Get it before it’s on the website – sign up for this briefing: <style type="text/css"
Please send me (select as required):
Email Format

