
But it’s not just Labour. Despite all of the party’s current difficulties, it should be noted that the its recent loss of support is in fact no more severe (and on some comparisons far less severe) than many of its sister parties on the continent. This chart is based on one that Chris Hanretty produced in 2015 with ParlGov data.
Following decades within a tight range – literally within a couple of points of its post-war average, support for social democratic parties across Europe has plummeted since 2005. And rather than stabilising, the post-crisis crisis of the centre-left looks set to accelerate. Current polling for the 2017 legislative elections in the Netherlands, France and (to a lesser extent) Germany suggests that Europe’s social democrats will have lost a quarter of the support they had in the middle of the last decade.
Labour’s drop in support has a particularly strong impact due to the UK’s first past the post electoral system, where losses in vote share can translate into much larger losses in seat share. Nevertheless, Labour still benefits substantially from the electoral system, because its share of seats remains considerably higher than its share of votes.

Might something even more extraordinary than what’s happened in 2016 happen in 2017? Here are the probabilities implied by Ladbrokes’ odds. If these probabilities are correct (and independent of one another), then the probability of none of these events happening in 2017 is just 24 per cent.
Of course, in reality they may not be independent of one another, at least in terms of expectations being wrong in similar ways. It’s also know that long odds can be compressed, because some people simply like betting on long shots.

When we consider what might happen in 2020, an important consideration is that election would be fought on redrawn constituency boundaries. The effect of using the new boundaries as currently proposed, compared with the current 2010 boundaries, would notionally increase the 2015 Conservative majority to 42 from 12.
As with the government’s voter ID proposals, this has been controversial, because the electoral register (the thing that used to be called the electoral roll) used to draw the boundaries was from December 2015, prior to the EU referendum registration rush, which saw it swell by over 2 million.
17 for '17 – a collection of charts for the new year
|
31st December 2016 |
About The Author
Related Posts

Analysis, EU referendum
FAQ: The Number Cruncher Politics EU referendum forecast
17th April 2016 |
|
Analysis
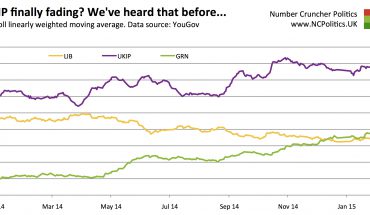
Conservatives and Labour squeezing the smaller parties? Hmmm….
5th February 2015 |
|
Analysis, EU referendum
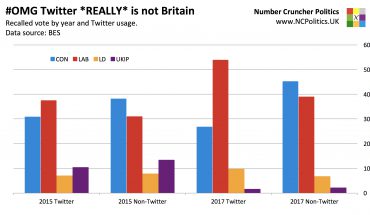
We knew social media wasn't representative, but these numbers are incredible
30th January 2018 |
|
Analysis
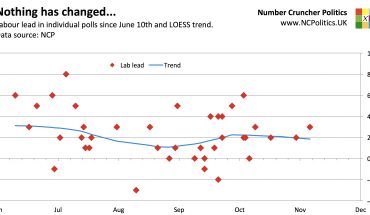
Why aren’t the polls moving? (Despite the chaos)
10th November 2017 |
|