What went wrong in 1992
Although I was young at the time, I remember 1992 well. I was allowed to stay up to see the exit polls, and went to bed still curious about what a hung parliament might involve. I woke up to discover that, contrary to all expectations, John Major had won. His popular vote lead was 7.6 points, 9 points (net) better than the final call polls, a polling failure so large that the Market Research Society ordered an inquest into opinion polling, for fear of a meltdown in confidence in market research altogether.
Subsequent investigations revealed that a disproportionate number of those saying they were undecided had voted Conservative in 1987 – many of them ended up doing so once again. There were also faulty demographic quotas (without the frequently-updated ONS updates, pollsters were relying on data from the 1981 census) as well as evidence of a genuine (though small) late swing. But the refusal of some Conservative voters to reveal their intentions was the most troubling because of the obvious difficultly in measuring it, let alone correcting for it.
In the years that followed, we heard talk of shy Tories and the more general concept of the spiral of silence. Labour strategist the late Philip Gould told the Adam Curtis BBC documentary “The Century Of The Self” that his focus groups in early 1992 had discovered people who admitted lying to opinion pollsters. Conservative-commissioned focus groups, Curtis explained, had found the same thing. Indeed, just before the BBC announced their 1997 exit poll, David Dimbleby even joked “we hope they’ve been telling us the truth!”
There were, of course, significant methodological changes in the mid-1990s. But 1992 and (if you care to go back that far) 1970 were not the isolated polling misses that many perceive them to be. 1992 was certainly the worst, but the reality is that elections close enough for polling error to stand out, don’t come around all that often. Largely unnoticed under Tony Blair’s Labour landslides, the shy Tory effect continued long after 1992.
Historical polling error – Perception vs reality
The “everything is fine now” perception may have been reinforced by the exceptional accuracy of exit polls. However, exit polls are completely different exercises, not least because they don’t have the problem of finding a representative sample of likely voters, but instead use a random sample of actual voters. There are no “don’t knows” and they also have clever methods for dealing with refusers. Even in 1992 the exit polls were significantly better than opinion polls (Harris/ITN predicted a 4 point Conservative lead in the popular vote and while the BBC didn’t mention the popular vote from their NOP poll, they had extremely similar seat numbers). There is a detailed writeup on exit polling here.
As for the regular opinion polls, what should we expect them to look like if they were totally unbiased? All polls have a margin of error, a 95% confidence interval within which the true state of public opinion should lie. Individual pollsters aim to be correct to within the headline margin of error of +/-2.2 percentage points for a typical poll of 2,000.
But for polls as a whole, the margin of error is much smaller due to the aggregation increasing the overall sample size. We would also expect errors to be symmetrically distributed, without any discernible pattern. But history shows that the errors seem to have a directional pattern.
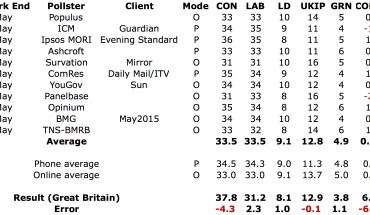
I’ve taken a look at the historical evidence, using the polling for which the fieldwork ended in the two days prior to the election (or the final 5 polls where fewer were conducted within that window), for each of the 12 general elections in the last 50 years, using Mark Pack’s excellent database. I didn’t pick 50 years as a round number, but rather because prior to 1966 the fieldwork was either too far in advance of polling day, or not dated, and there were very few pollsters back then anyway.

In 10 of these 12 elections, the Tories were underestimated by the polls, in one (February 1974) the polls were spot on and in one (1983) they were overestimated. Later I’ll show the reasons why this apparent exception is in fact quite consistent with the overall pattern. However it’s also worth noting that the 1983 election was unique in recent times in that over the 12 months preceding it, the government enjoyed a poll lead that was both large (around 13 points) and significantly wider than when it was elected, both of which may be relevant.

What about Labour? Labour have typically been overestimated by pollsters – 9 times in the last 12 elections. Of the three instances of them being underestimated, one of them (1983), is the counterpart to the equal and opposite error in the Conservative vote share mentioned above. The other two (February 1974 and 2010) corresponded with a large overestimation of the Liberal or Lib Dem vote (on the other 10 occassions, the Liberal/Alliance/Lib Dem vote was very accurately estimated, with the polls always within 1.2 points of the outcome.)
In terms of the spread between the Conservative and Labour vote shares, the polls have favoured Labour at 9 out of the last 12 general elections, including 5 of the last 6.
(Continued, please navigate using numbered tabs…)