See also: Is there a shy Tory factor in 2015? in which NCP predicted the polling failure the day before the election.
So the election is over and to the surprise of almost everyone, Britain isn’t talking about government formation. Instead, the UK is trying to understand how the Conservatives captured the prize they last claimed a generation ago – in uncannily similar circumstances – an outright majority (of 12 seats in theory, but 16 in practice taking into account abstentions).
The fears of some pollsters were realised – Thursday night was the worst for opinion polling in Britain since 9th April 1992. As then, and 1970, the Market Research Society (this time via the British Polling Council) will set up an independent investigation into how the polls indicated the wrong winner. This piece is very much a first-glance assessment, in which I’ll quantify the error, explain what we know already, then consider the causes of failure.
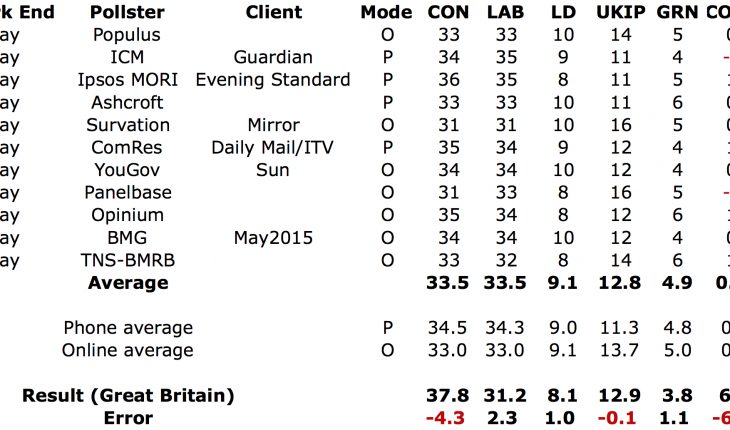
All of the pollsters in the following tables are members of the BPC, apart from newcomer BMG Research whose application is pending, and Lord Ashcroft, who subcontracts his fieldwork to BPC member firms. Also, a reminder that opinion polls do not include Northern Ireland, so the correct comparison is with the mainland vote share of each party.

The CON-LAB spread error was 6.5 points, compared with 9 points in 1992. The Combined “big two” share of the popular vote was underestimated by 2 points. The counterparts to this were the errors on the Lib Dems and Greens, each of which were overestimated by about a point. Despite all the concerns about polling for UKIP, the polls on average were spot on (though there were substantial differences between individual pollsters).
A few points I’d make on what we know at present:
- There was no overall difference between phone and online accuracy. Both modes, on average, had Labour and the Conservatives tied, the Lib Dems on 9% and the Greens on 5%. They differed slightly on UKIP, but were wong in opposite directions.
- There was no shy Lib Dem factor nationally. No pollster underestimated the Lib Dem national vote share (though no-one overestimated it hugely either). The national polling on the Lib Dems was pretty good.
- Lord Ashcroft’s polling was not underestimating Lib Dem incumbents by not naming them. Lib Dem incumbents in seat polling were actually overestimated by pollsters (I’ll consider constituency polling in a separate piece).
- Past vote weighting is not a conspiracy against UKIP. The polling on UKIP (in aggregate) was spot on.
- The SNP surge was as large as expected. Their share of the Scottish vote was 49.97%. I’ll look at Scotland in a separate piece, though the polls there were pretty accurate.
- Reports of high turnout can be erroneous (and were). I remember hearing similar reports at the European elections, and turnout was 35.6%, up just 0.9 points on 2009. 2015 general election turnout was 66.1%, up just 1 point, 0.7 points of which were accounted for by the vastly increased turnout in Scotland. Turnout in England and Wales was almost completely unchanged.
- Swingback did occur, and almost like clockwork – it just wasn’t reflected in the polls. The national swing from the Conservatives to Labour since 2010 was just 0.3%.
Turning to the causes of the error, I would urge everybody to avoid jumping to conclusions about what happened. The BPC is investigating, as are individual pollsters (who, unlike in 1992, have huge amounts of data to hand) and NCP will also investigate. However there are three areas that are of obvious concern:
- Electoral flux making past vote weighting ineffective. As I wrote on Wednesday, one of the clearest risks was that the complexity in the shifts of support would blunt the effectiveness of post-1992 adjustment techniques. My sense from the initial results, confirmed on Friday by Steve Fisher from the exit poll team, was that this had indeed happened – it looked like the polls had overestimated the proportion of UKIP support that came from the Conservatives and underestimated that which came from Labour, with a knock-on effect on estimates of support for the two main parties.
VERY early to say, but IF UKIP is doing better with ex-LAB voters and/or worse with ex-Tories than polls thought, that could explain a lot
— NumbrCrunchrPolitics (@NCPoliticsUK) May 7, 2015
- Shy, reluctant or cognitively dissonant voters. This isn’t a new problem, but nor is it simple. Obviously it will be re-examined, and certain assumptions need to be challenged. In particular, it was received wisdom that there would be less “shyness” online than on the phone with a live interviewer. There may yet be truth in this theory, but it needs to be reconsidered.
- Overestimated likelihood to vote. It’s always been the case that self-reported turnout measures, which are used to adjust the data, overstate (often by some margin) the probability of respondents actually voting. As long as the overestimation is even between parties, the polls will still be right. The problem is that it might not have been, as Andy White warned before the event.
These three factors aren’t necessarily additive – they overlap and interact in plenty of ways. I would also encourage those less familiar with polling to read the British Polling Council’s FAQs and media guide and UK Polling Report’s primers on sampling, weighting, turnout and the voters who say they don’t know.
I’ll post further analysis over the coming weeks.


