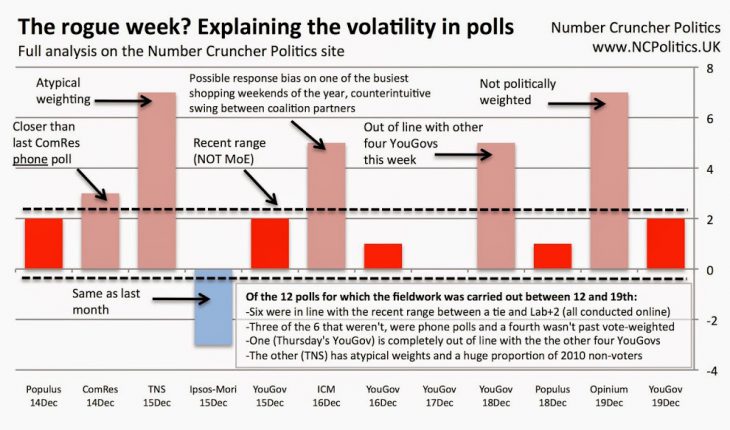
The majority of polls in the last week have shown between a Labour and Conservatives tie and Labour ahead by 3 (and half of them between a tie and a Labour lead of 2). But as usual it was those that differed significantly that got all the attention.
Of the 12 polls for which the fieldwork was carried out between December 12 and 19th:
- Six were in line with the recent range between a tie and Lab+2 (all conducted online)
- Three of the 6 that weren’t, were phone polls and a fourth wasn’t past vote-weighted
- One (Thursday’s YouGov) is completely out of line with the the other four polls this week from the same house
- The other (TNS) has atypical weights (2010 past vote proportions skewed far more towards Labour than other pollsters) and a huge proportion of 2010 non-voters
But phone polls have shown pretty similar Labour vs Conservative spreads in recent months, and phone polls are often considered more reliable, because they use a random(ish) sample rather than a panel. So why might they have been so volatile this week? Firstly it’s worth mentioning that phone poll response rates are woeful at the best of times – I’ve never heard a UK phone pollster disclose their response rate, but in the US it is shockingly low – 12% is now typical, according to FiveThirtyEight. As I wrote on Wednesday, phone polls are still largely conducted over landlines, and since last weekend would have been one among the busiest shopping periods of the year, many people wouldn’t have been home to answer. Likewise during the week, many will have been late-night shopping, at office parties and so-on. Of course, the pollsters still found enough people to poll. But the risk is that amid lower-than-normal response rates at this time of year, they ended up with an unrepresentative sample.
Opinium (7-point Labour lead) doesn’t use political weighting. This seems to be fine at election time (Opinium did very well at the 2010 election), but in mid-term polling this approach can lead to extra volatility if one set of supporters are more enthusiastic or (as could have been the case here) those that are home to respond aren’t representative. Of course, their polls do use all the usual demographic and other weighting, which will undoubtedly remove a lot of this response bias, but only to the extent that it correlates with the sorts of weighting being used. If there is bias within each weighting ‘cell’, it will still be there afterwards.
ComRes and ICM do weight by past vote, and indeed ComRes‘s numbers were very close to those of the online polls (and actually showed a smaller Labour lead than last month). ICM showed a move that – thinking about what it respresents politically – looked odd, a swing between the two coalition partners. On examination, the tables (in particular the 2010 Lib Dem crossbreak) looked curious, which might have been timing-related. Since ICM’s polling is 85% landlines, it’s not hard to see how even they could have been tripped up.
Ipsos-MORI showed a 3 point Tory lead, but that was exactly what they showed last month.
YouGov also had a five-point lead on Thursday – there was nothing too odd-looking in the internals of this poll, but note that the same pollster published four other surveys this week, which averaged a Labour lead of 1.25 points. For a sample of 1,981 and these polling levels, the spread margin of error is about +/- 3.5 points. So unless there was some kind of short-term factor (YouGov’s polls have a very compact fieldwork window) it looks like this one was just a good old-fashioned rogue poll, statistically just as you’d expect in 5% of any polster’s polls (ie once every 4 weeks for YouGov).
And finally, a 7-point Labour lead from TNS-BMRB, who as far as I’m aware don’t regularly poll voting intention. TNS do weight by past voting, but 2010 Labour voters are massively oversampled compared with 2010 Conservative voters. Pollsters normally do this to correct for what’s known as recall error, but they typically have 20 or 21% more 2010 Conservative voters than Labour, compared with 24.2% more in the actual 2010 election – this poll had only 11% more. So how come last month showed a very unremarkable 1 point Labour lead? I spotted on page 33 of this month’s tables that 39% of the sample didn’t vote in 2010, a very reasonable number given that the actual abstention rate was 35% and 4-5% of today’s voters would have been under 18 at the time. But roughly half of their 2010 non-voters now say they would definitely or probably vote, implying an astonishing increase in turnout to Scottish referendum levels. Last month this group favoured the Tories by 9 points, which offset the oversample – this month they favoured Labour by the same margin, which added to it, hence the large labour lead. If you apply normal past vote weighting and only consider those that voted last time, both parties are on about 33%.
Among other parties, the Lib Dems were on anything from 5 to 14% and the Greens polled between 4 and 9 or 10% – pollsters vary considerably as to the levels of these two parties, but most agree on the trend – Greens up, Lib Dems down. And UKIP, who usually cause more variation between pollsters than any other party, this time had one of the smallest ranges!
To conclude, when polls show sharp movements, it’s tempting to look for a narrative. But when polls diverge as much as this, I would exercise considerable caution. We’ll get a better idea of the true picture in the new year.


