There is little space for ambiguity, the results of these two by-elections represent a triumph for the Conservatives, disaster for Labour, a serious setback for UKIP and disappointment for the Lib Dems.
What an extraordinary achievement for the Conservatives, gaining a seat from the main Opposition party on a swing of 6.7 per cent and increasing their share in Stoke, when they should have been squeezed.
For Labour and its leadership this was a disastrous set of results, with UKIP’s underperformance in Stoke Central seized as a fig leaf to cover Labour’s own miserable lack of achievement. Every Labour disaster is met with mantras extolling a new style of politics personified by their unpolished but authentic Leader and by proclaiming their success in social media. To many others it’s all very simple, if old-fashioned, namely, a party accelerating towards failure at the next general election.
There is nowhere to hide for UKIP’s Paul Nuttall: he was the one who upped the ante by putting the capture of Labour seats in the frame. After a car crash of a campaign he only managed a 2.1 per cent swing from Labour and narrowly avoided being pushed into third place by the Conservatives. UKIP have fought eight of the ten by-elections in this parliament and have come second in five of them. I think they will be around for some time yet but they will struggle to be heard.
There was not much in either of these two by-elections for the Lib Dems but after their Richmond Park by-election gain it is no help to their future prospects that they were such marginal bystanders.
Copeland
As a result of the 2015 general election, Copeland was the 30th most marginal Labour seat in Britain.
Main party vote shares in Copeland constituency in general elections 2005-15
| Con | Lab | LD | UKIP | Other | |
| % | % | % | % | % | |
| 2005 * | 33.5 | 46.7 | 13.9 | 2.3 | 3.6 |
| 2010 | 37.1 | 46.0 | 10.2 | 2.3 | 4.3 |
| 2015 | 35.8 | 42.3 | 3.4 | 15.5 | 3.0 |
| 2017 by-elec | 44.2 | 37.3 | 7.2 | 6.5 | 3.0 |
* notional result calculated on the basis of the changed 2010 boundaries.
The Conservatives took the seat from Labour on a swing of 6.7 per cent – the first Government by-election gain since Mitcham & Morden in 1982. Disputes have broken out as to whether the Conservative performance is the best for a Government party since the 1960s or the 1870s; but there is no dispute about the scale of the disaster for Labour after seven years in Opposition losing a seat they had held since 1935.
Stoke on Trent Central
As a result of the 2015 general election, Stoke Central was the 86th most marginal Labour seat in Britain.
Party vote shares in Stoke on Trent Central constituency in general elections 1983-2015
| Con | Lab | LD* | UKIP | BNP | Other | |
| % | % | % | % | % | % | |
| 1983 | 29.4 | 48.1 | 21.4 | – | – | 1.1 |
| 1987 | 31.0 | 52.5 | 16.5 | – | – | – |
| 1992 | 27.9 | 58.0 | 13.6 | – | – | 0.4 |
| 1997 | 16.7 | 66.2 | 11.9 | – | 1.5 | 3.6 |
| 2001 | 18.9 | 60.6 | 14.6 | – | – | 5.8 |
| 2005 | 17.3 | 52.9 | 17.9 | 3.3 | 7.8 | 0.9 |
| 2010 | 21.0 | 38.8 | 21.7 | 4.3 | 7.7 | 6.4 |
| 2015 | 22.6 | 39.3 | 4.2 | 22.7 | – | 11.3 |
| 2017 by-elec. | 24.3 | 37.1 | 9.8 | 24.7 | 4.0 |
*SDP in 1983 and 1987
Labour held the seat with its lowest share of the vote for at least three decades, on a 2.1 per cent swing to UKIP. The palpable sighs of relief from Labour that they did not lose this seat spoke volumes about where the party currently languishes in British politics. They might see the result as a triumphant victory against UKIP but why was UKIP such a threat in the first place? And what might have happened if Paul Nuttall had not experienced such a monumental car crash of a campaign? Even with it he still managed a small swing from Labour. And lest we forget, the Conservatives increased their share and only narrowly failed to take second place from UKIP.
By-elections in Labour-held seats 2010-17
Including Copeland and Stoke Central, there have been 21 by-elections in Labour-held seats since their defeat in the 2010 general election. Twenty of these are listed below (I have excluded Batley & Spen because the Conservative, Lib Dem and UKIP parties did not contest the by-election) along with their changes in vote share compared with the previous general election. Prior to 23 February 2017, Labour held all of them except Bradford West which they lost to George Galloway in March 2012.
2010-15 Parliament
| Seat | Con | Lab | LibDem | UKIP | Result | T’out |
| % | % | % | % | % | ||
| Oldham E & Sad’worth 13.1.11 | -13.6 | +10.3 | +0.3 | +1.9 | Lab Hold | 48.7 |
| Barnsley Central 3.3.11 | -9.0 | +13.5 | -13.1 | +7.5 | Lab Hold | 37.0 |
| Leicester South 5.5.11 | -6.2 | +12.3 | -4.4 | +1.4 | Lab Hold | 43.9 |
| Inverclyde 30.6.11 | -2.1 | -2.2 | -11.1 | +1.9 | Lab Hold | 45.4 |
| Feltham & Heston 15.12.11 | -6.3 | +10.8 | -7.9 | +3.5 | Lab Hold | 28.7 |
| Bradford West 29.3.12 | -22.7 | -20.3 | -7.1 | +1.3 | Other Gain | 50.8 |
| Cardiff S. & Penarth 15.11.12 | -8.4 | +8.4 | -11.5 | +3.5 | Lab Hold | 25.7 |
| Manchester Central 15.11.12 | -6.5 | +16.4 | -17.2 | +3.0 | Lab Hold | 18.2 |
| Croydon North 29.11.12 | -7.2 | +8.7 | -10.5 | +4.0 | Lab Hold | 26.4 |
| Middlesbrough 29.11.12 | -12.5 | +14.6 | -10.0 | +8.1 | Lab Hold | 25.9 |
| Rotherham 29.11.12 | -11.3 | +1.6 | -13.9 | +15.7 | Lab Hold | 33.8 |
| South Shields 2.5.13 | -10.0 | -1.5 | -12.8 | 24.2* | Lab Hold | 39.3 |
| Wythenshawe & Sale East 13.2.14 | -11.0 | +11.2 | -17.4 | +14.5 | Lab Hold | 28.2 |
| Heywood & Middleton 9.10.14 | -14.9 | +0.8 | -17.6 | +36.1 | Lab Hold | 36.0 |
*No UKIP candidate in 2010 general election
2015+ Parliament
| Seat | Con | Lab | LibDem | UKIP | Result | T’out |
| % | % | % | % | % | ||
| Oldham W & Royton 3.12.15 | -9.6 | +7.3 | 0.0 | +2.8 | Lab Hold | 40.1 |
| Sheffield Brightside & H’boro 5.5.16 | -5.4 | +5.8 | +1.6 | -2.2 | Lab Hold | 33.0 |
| Ogmore 5.5.16 | -3.3 | -0.8 | 0.0 | +1.0 | Lab Hold | 42.4 |
| Tooting 16.6.16 | -5.8 | +8.7 | -1.3 | -1.3 | Lab Hold | 42.8 |
| Copeland 23.2.17 | +8.4 | -5.0 | +3.8 | -9.0 | Con Gain | 51.3 |
| Stoke on Trent Central 23.2.17 | +1.8 | -2.2 | +5.6 | +2.0 | Lab Hold | 38.1 |
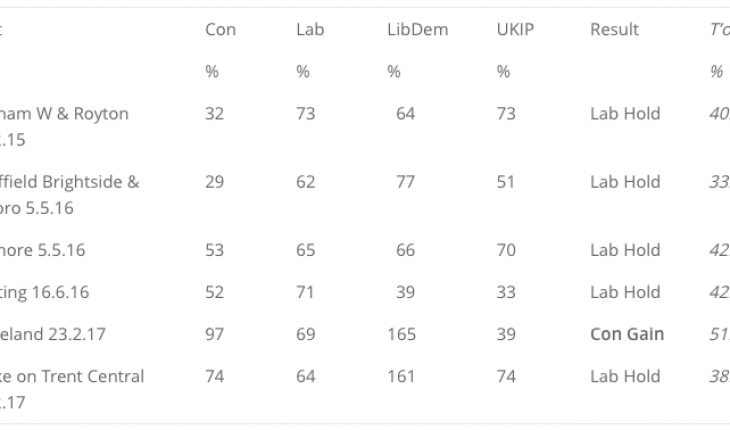
Retained Votes in Labour by-election seats
The table below shows what percentage of their previous general election vote each of the main parties retained in the by-election.
2015-20 Parliament
| Seat | Con | Lab | LibDem | UKIP | Result | T’out |
| % | % | % | % | % | ||
| Oldham W & Royton 3.12.15 | 32 | 73 | 64 | 73 | Lab Hold | 40.1 |
| Sheffield Brightside & H’boro 5.5.16 | 29 | 62 | 77 | 51 | Lab Hold | 33.0 |
| Ogmore 5.5.16 | 53 | 65 | 66 | 70 | Lab Hold | 42.4 |
| Tooting 16.6.16 | 52 | 71 | 39 | 33 | Lab Hold | 42.8 |
| Copeland 23.2.17 | 97 | 69 | 165 | 39 | Con Gain | 51.3 |
| Stoke on Trent Central 23.2.17 | 74 | 64 | 161 | 74 | Lab Hold | 38.1 |
