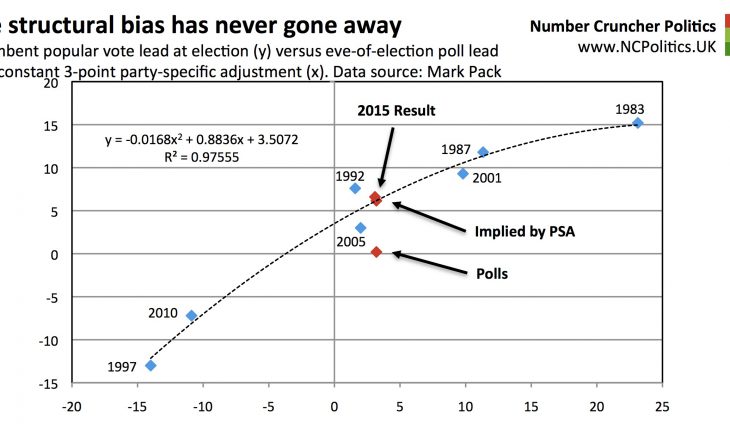
See also: Is there a shy Tory factor in 2015? in which NCP predicted the polling failure the day before the election.
Ten days ago I had to make the biggest call in the year or so that I’ve been watching opinion polls. I was convinced that the election would see a once-in-a-generation polling failure which, like 1992 and 1970, would cause the wrong winner to predicted.
Polling errors on the scale seen last week are rare in countries with modern, well-established polling. Many people, including some very smart people (notably Dan McLaughlin) have tried to call them publicly in the past, only for the pollsters ultimately to be proved right. What made me feel that this time was an historic exception was the breadth and depth of the evidence that something wasn’t quite right.
There have been many forecast models published in the run up to this election, but as far as I’m aware, only two made allowance for polling error. None attempted to predict polling error in 2015 directly, mainly because those behind them didn’t think it was possible. Chris Hanretty, who was instrumental in the Newsnight Index and the so-called “Nate Silver” prediction told me “if you can do that it’s like finding Eldorado”.
I’m not averse to a challenge so I decided to accept. But how well did the NCP models hold up? First of all, here’s a look at the polling errors that actually occurred. In terms of the Conservative vote share, the polls did only fractionally better than in 1992:

On the lead, which may be a less ideal measure than the share statistically, but is far more useful for predicting election outcome, the picture was more of the order of 1970:

Because the Lib Dem national vote share was measured pretty accurately by the polls, the latest data points on the Con vs Lib+Lab charts weren’t hugely different, but here they are for completeness. Firstly the shares:

And the spreads:

(Continued, please navigate using numbered tabs…)


