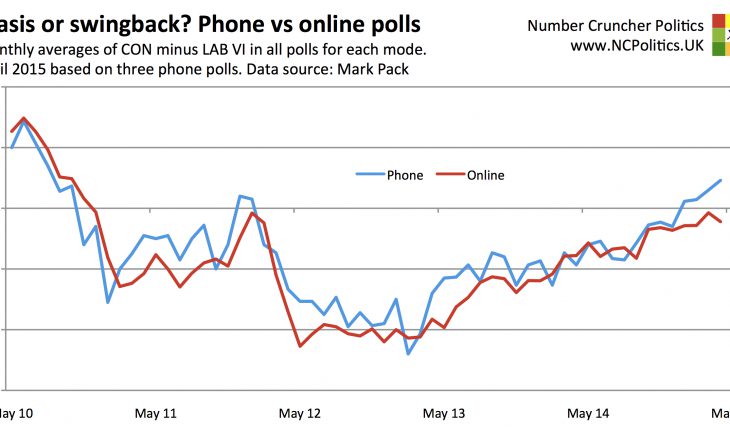
Having seen the interesting piece by Adam Ludlow at ComRes, which highlighted the differences between recent phone and online polls, I thought I’d put together a chart comparing the spread between the two main parties’s support as measured by each mode over the entire parliamentary term. My source, as usual, is Mark Pack’s opinion poll database.

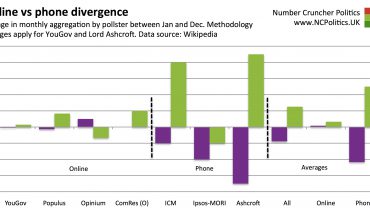
The first point to make is that the two modes generally produce very similar results. However the chart shows that, on average, Labour does better relative to the Conservatives in online polls than in telephone polls, and that the pattern has been reasonably consistent since 2010, except during the two periods where the Tories were losing ground – the first 6-8 months of the parliament, and the spring of 2012 after the Omnishambles budget. It’s worth remembering that there are also substantial differences between different pollsters (house effects) in addition to these mode effects.
Of particular interest is the most recent six month period, which the ComRes piece referenced (their figures differ slightly from mine because I’ve computed the average in a different way). The online polls show a small but persistent Labour lead. The phone polls, by contrast, show a classic “swingback” pattern, where an incumbent recovers from mid-term weakness.
Aside from the obvious question of which mode provides the most accurate snapshot of public opinion, this divergence also highlights an issue with some polling averages – those that weight polls equally tend to weight online polls much more heavily, because they are more frequent. Those that weight by sample size magnify this effect, as online polls usually have sample sizes of double the 1,000 or so that’s typical of phone polls.
Swingback or stasis? A comparison of phone vs online polls
|
14th April 2015 |
About The Author
Related Posts
Analysis
UK Opinion polls (so far) in 2015
20th January 2015 |
|
Analysis, Roundup
Super Thursday preview
5th May 2016 |
|
Analysis, Poll alert
We did a poll. Here’s why, and what we found
6th April 2018 |
|
Analysis
Polling inquiry report published
30th March 2016 |
|