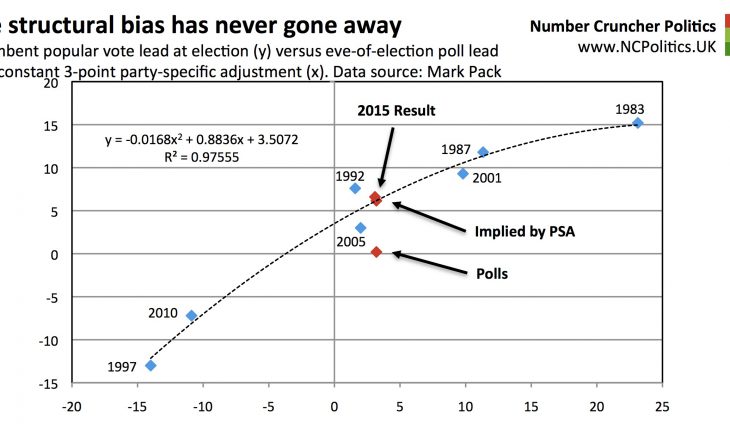
The next chart illustrates a point that I made in the piece where I made the call – it’s possible that we’re all barking up the wrong tree looking for 2015-specific factors. The most accurate of the three NCP models was the one that, if I’m honest, I thought the least sophisticated or reliable. In fact, using a constant three-point shy Tory effect, combined with an anti-incumbent bias that was allowed to vary according to how the government was polling, was within 0.2 points of the outcome:

On the leader-based measures, it’s pretty clear that Ed Miliband’s poor ratings weren’t actually “priced in”. The concept of pricing in comes from the way investors value future returns given uncertainty. Voting is a choice based on far more complex processes of thought and emotion than simply pulling out a calculator, hence the inconsistency. This model also fared pretty well:

The local elections-based model did less well on the popular vote share, although it was the only model that predicted a Conservative majority. But given the behaviour of the spread, did the Conservatives outperform relative to Labour in local elections, or underperform in the general election? The other two models are more consistent with the first of these. But it is possible – and this does require further analysis – that the difference can be attributed to changes in the last year of the parliament. It could be that the improvement in Ed Miliband’s personal ratings prevented a much heavier defeat in England and Wales. Alternatively, it could be the micro-targeted Tory campaign might have achieved a swing more in line with the model in the marginals, that wasn’t reflected nationally.

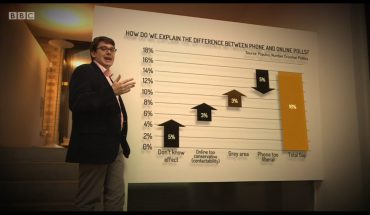
The debrief analysis will be ongoing – I’ve already spotted a few things since my last post. I’ve also spoken on Keiran Pedley’s Polling Matters show about some of these issues.
| Actual | NEVL | GSS | PSA | Combined | Error | |
| 1983 | 15.2 | 15.3 | 14.6 | 15.0 | 14.9 | -0.3 |
| 1987 | 11.8 | 9.5 | 11.6 | 11.4 | 10.8 | -1.0 |
| 1992 | 7.6 | 7.2 | 5.5 | 4.9 | 5.8 | -1.8 |
| 1997 | -13.0 | -10.7 | -13.5 | -12.2 | -12.1 | 0.9 |
| 2001 | 9.3 | 10.6 | 11.2 | 10.6 | 10.8 | 1.5 |
| 2005 | 3.0 | 4.7 | 3.1 | 5.2 | 4.3 | 1.3 |
| 2010 | -7.2 | -9.8 | -5.9 | -8.1 | -8.0 | -0.8 |
| 2015 | -6.6 | 10.9 | 7.6 | 6.8 | 8.4 | 1.6 |
Finally, may I express my appreciation for all the shares, coverage, links, etc. NCP is completely independent – it isn’t bankrolled by a polling company, or a media empire, or political organisation, or an academic institution or a generous billionaire. This site is viable thanks to your continued support – thank you!