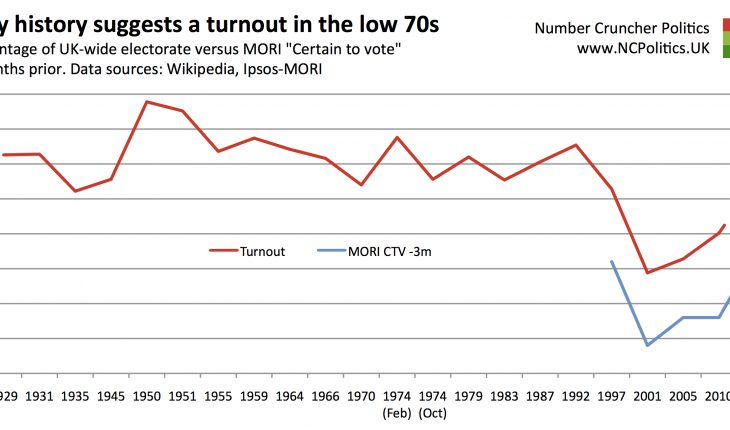
Yesterday's Ipsos-MORI poll for the Evening Standard, by general consensus, didn’t quite live up to its “corker” billing, although one stat more noteworthy than many people realise (including myself, until I’d looked at the data) was the “certain to vote” figure of 62 (+1 – the unrounded figure was 62.2%). Sir Bob Worcester founded Market & Opinion Research International in 1969 and MORI (now Ipsos-MORI) has been polling general elections since the 1970s. One benefit of having such a long time series concerns turnout projection. Initially, the question was only asked immediately prior to the election. But from 1997 onwards, likelihood to vote was also polled well beforehand. And in the time since, it’s shown a remarkably consistent pattern.
To be clear, those saying they are “certain to vote” shouldn’t be counted one-for-one – plenty of them won’t vote, while plenty of less-than-certain voters will. But comparing the actual turnouts to the figure from the poll in the month three months prior to the election month, gives a change of +10.4pts in 1997, +10.4 again in 2001,+ 8.4 in 2005 and +12.1 in 2010, for an average of +10.3. So on that basis we’d expect something between 70 and 75%, with a midpoint of 72.5% (As an aside, given that 2010 was at the higher end of the range, these numbers might suggest that the 2010 leadership debates did make the electorate more likely to vote, but only slightly – of course, they may still have had a bigger influence on how people voted.)

Who would high turnout (by modern standards) favour? There are various theories about who it may help or hinder, and it’s important to consider the impact both on the popular vote and the skew, of which relative turnout tends to be the primary driver. And if the independence referendum (turnout 84.6%) has enthused voters in Scotland more than elsewhere, we need to consider that too (although analysis of BES data suggests it hasn’t).
On the face of it, the two most obvious patterns are (1) a secular decline over time and (2) that an expected close result gets the vote out. It’s no accident that 1992 and Februrary 1974 saw the highest percentage turnouts in the last half a century, while 2001 saw both the lowest turnout, and the largest drop in turnout, in the history of universal suffrage.
If history is a guide, turnout will be 70-75%
|
13th February 2015 |
About The Author
Related Posts
Analysis, EU referendum
Super Thursday postmortem (and what it tells us about Brexit)
10th May 2016 |
|

Analysis
How should we interpret the early results in the Scottish referendum? Part III – With regional adjustments
18th September 2014 |
|
Analysis
10 days on, a look back at the "Shy Tory" prediction
16th May 2015 |
|
Analysis
Is there evidence of pollsters herding?
25th June 2015 |
|