May I start by expressing sympathies to all of those affected by today’s tragic lorry crash in Glasgow’s George Square. I’m continuing to follow the updates and my thoughts are with the victims and their families at this difficult time.
Last night, Survation published the first Scottish poll Since Jim Murphy’s victory in the Scottish Labour leadership race. Given that there are still relatively few Scottish Westminster polls, this one was eagerly anticipated. And in the light of the considerable volatility in recent GB polling, the results have rightly been subject to scrutiny. But it seems the Twitterverse has scrutinised the tables and reached a totally wrong conclusion. First, the toplines:
Survation Scotland W’mnstr:
SNP 48 (+2)
LAB 24 (=)
CON 16 (-1)
LIB 5 (-1)
UKIP 4 (-1)
GRN 1 (-1)
Size 1,000
Writeup http://t.co/P5PwQp3jni
— NumbrCrunchrPolitics (@NCPoliticsUK) December 21, 2014
The fieldwork was done from the 15th to 18th December and the sample size was actually 1,001. So compared with Survation’s poll last month, there has been a further 1% swing from Labour to the SNP, almost exactly what the aggregated model (which I’ll come onto later) would have predicted.
But it wasn’t long before some were tweeting that the sample contained a majority of “yes” voters, with 53% being mentioned. This would have skewed the results in the SNP’s favour, relative to a sample that had the 45 percent represented in proportion. I’m not entirely sure where this idea started, and in fact some of the tweets have since been deleted.
Looking through the tables for the Westminster question, the only set of indyref numbers even close to 53% for “yes” were in table 16 – specifically the unweighted proportions of those likely to vote (410 “yes”, 370 “no,” which is just about enough to round up to 53%). I’m going to give the benefit of the doubt and assume that the use of this number was a mistake, because otherwise it’s the most egregious example of cherry-picking I’ve seen in the whole of 2014.
Yes, raw samples can contain too many “yes” voters, or too many “no” voters or too many of a particular age group, gender, socioeconomic classification (and in most cases past vote) and so on. That’s precisely why polls use weighting, so that the weighted sample, from which the results are computed, is an accurate representation of the Scottish electorate. If you use the weighted number from this table, “yes” voters were a minority (49.1%).
But this is still misleading, because likelihood to vote is an element of voter intention, it is nothing to do with sampling. It is quite reasonable to weight the final results by LTV (often just called turnout) and many pollsters do this. But this poll is suggesting that “yes” voters are more likely to vote than “no” voters. If we want to know whether the sample was correctly weighted – which is the issue in question – we need to look at the weighted figures in the ‘all respondents’ table. There we find 411 “yes” and 509 “no”. Dividing 411 by (411+509) gives, to one decimal place, the exact referendum “yes” share of 44.7%.
So consider this nonsense debunked.
Survation also asked about Holyrood and found a pretty similar picture to Westminster voting for constituency VI, while in terms of regional voting both the Scottish Greens (9%) and UKIP (7%) would poll high enough to see them represented in Holyrood, the latter for the first time.
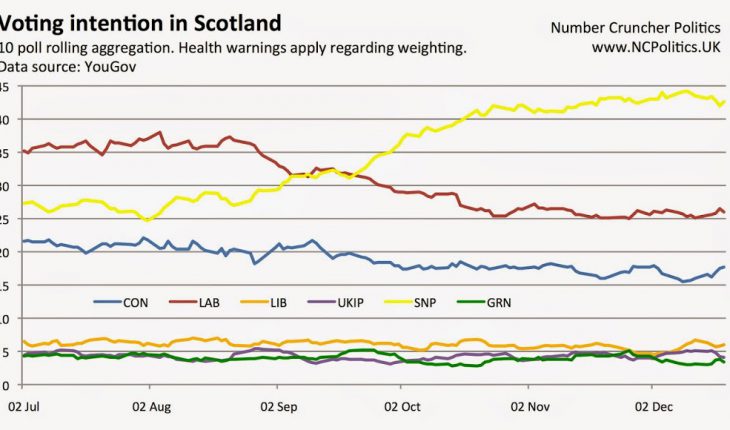
Turning to the aggregated model of voting intention, latest figures are of SNP 43 (-1) LAB 26 (=) CON 18 (+2) LIB 6 (+1) UKIP 4 (-1) GRN 3 (=). The electionforecast weighted measure has SNP 44 (-2) LAB 32 (+2) CON 11 (=) LIB 6 (=) GRN 4 (=) UKIP 2 (=). Both of these measures straddle the Labour leadership announcement, so can’t tell us anything about its impact. But if we compare one-week samples (N~850) from this week with last week, we see virtually no change whatsoever.
This is entirely consistent with my view above, that the swing from Labour to the SNP had happened before Murphy’s election and there is no sign of any bounce related to it, positive or negative. Furthermore, Survation also asked whether having Murphy as leader would make voters more likely to vote Labour, which showed a reasonably even split between “more” (14%) and “less” (18%) and an overwhelming majority (57%) saying it made no difference.
So after a historic year in Scottish politics, that (as far as I’m aware) is all for 2014. Lord Ashcroft’s constituency polling will start after Hogmanay and will be very useful information indeed. Seasons greetings to all.


