Today we got the results of the face-to-face component of the 2017 British Election Study. For those unfamiliar with the reasons why this is such a big deal, this is a random probability survey, with repeated callbacks – its researchers selects addresses at random and try as many times as necessary (20, in one case) to secure the 45-minute interview. As a result, it’s the closest thing psephologists get to the holy grail of a representative sample, which in turn allows us to analyse the election without a lot of the caveats we have to use with conventional opinion polls.
That said, a few caveats remain. Even a gold standard survey has margins of error, about ±2.2 points on the full sample and higher on subsamples – even more so when we’re comparing one election against another. Also, the reported vote still doesn’t quite match the election result, so the following analysis uses weighting to the 2017 vote shares and turnout.
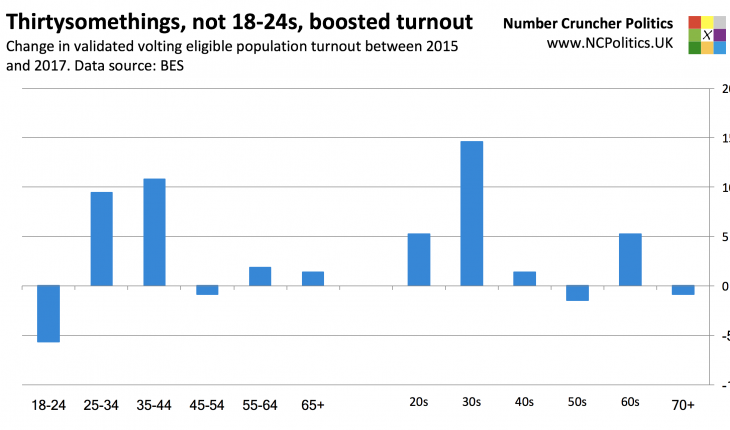
The “youthquake” was really among thirtysomethings
Good luck trying to find a precise definition of “youth”, but it’s probably fair to say that most people talking about a “youth surge” in turnout in 2017 were referring to under 25s. And they were wrong… The BES found no statistically significant increase in turnout between 2015 and 2017.
The surge was instead significant among thirtysomethings, and likelier-than-not among 25-44s:
The @BESResearch 2017 is out ?
Key finding – the surge in turnout wasn’t among the “youth”, but among thirtysomethings. More follows https://t.co/q6KvFohvVp pic.twitter.com/cxq9YXQkmL— Number Cruncher Politics (@NCPoliticsUK) January 29, 2018
The pattern is clearer still if we show the changes in each bucket. Note that the increase in turnout among twentysomethings is entirely among the older half of that age group:

As a side note: the pattern of turnout changes compared with the EU referendum shows the same surge among 25-44s. (We can’t make the same comparison as GE to GE because there was no face-to-face BES with vote validation in 2016, but it looks very similar).
The real age effect wasn’t turnout, but the difference in swing
Where the 18-24s were more dramatic than voters a bit older than them was in vote choice. The divergence by age really was as stark as polls suggested, with under-25s backing Labour by almost 50 points, and over-65s backing the Conservatives by almost 40 points.

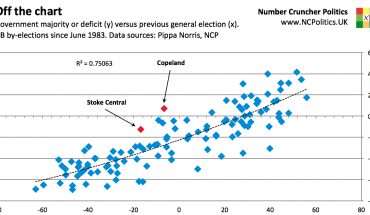
The Tories have always done better with older people than younger people, but not to the extent seen last June. Under 45s generally swung towards Labour from 2015, though the swings were biggest among under 25s. If there was indeed a youthquake it was this chart of the Tory lead (or deficit):

(Continued, please navigate using numbered tabs…)