So after much speculation, the boundary Commissions in England and Wales have published their initial proposals for the consituencies to be contested at the next general election. We’ve already seen the boundaries for Northern Ireland and those for Scotland will be published next month.
So what impact will the boundary changes have? The question of which seats disappear – a favourite of the press – is a poor guide to how the parties overall affected (though it does of course matter to individual MPs). Very often a seat will disappear in name, only to be replaced by something substantially similar. By the same token, relatively small changes can tip a seat from one party to another, or turn a marginal into a much less interesting seat, or vice versa.
There is no single “right” answer about how the 2015 election would have looked on the proposed boundaries, because unlike many other countries, UK general election results are only made available at constituency level. Working out which parts of a seat voted which way – necessary in order to underestand the effect of taking them apart and putting them back together again in a different configuration – involves estimation. There are different ways of doing it, either by local election results (the traditional approach) or using other data such as low-level demographics.
It’s a science, but not a perfect one, and different models get slightly different results. Also, as we don’t yet know what the Scottish boundaries will look like, some assumptions are necessary. Given the small majorities and the results in surrounding seats last May, it seems likely that the successors to Labour’s Edinburgh seat and the Tories’ seat in the south will notionally be SNP-held, though of course it’s perfectly possible that either is won “back” by its incumbent. Orkney and Shetland is a “protected” island seat and is not subject to review, so notionally stays Lib Dem.
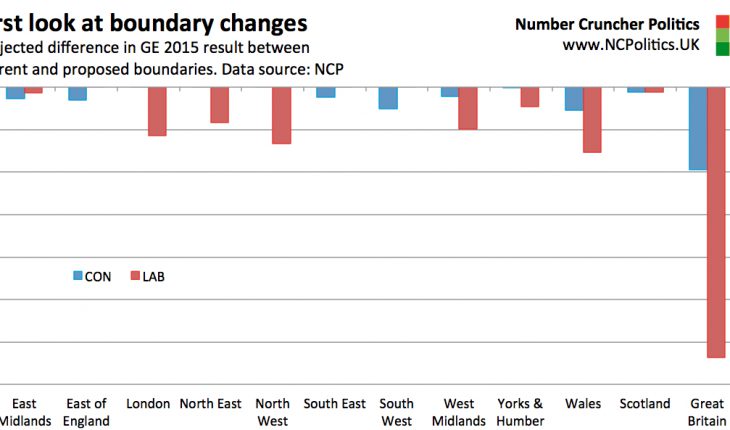
So with all the context and the caveats out of the way, here is the projection:
CON 321 (-10)
LAB 200 (-32)
SNP 52 (-4)
LD 6 (-2)
PC 3 (=)
UKIP 1 (=)
GRN 0 (-1)
NI 17 (-1)
That gives a Conservative majority of 42 seats.

As expected, most of the seat losses are Labour’s, though the Conservatives lose 10 seats, with a disproportionate number in Wales. Behind the modest net changes there will be quite a lot of local disruption, but less than other parties. Even though the details are substantially different from the aborted 2013 review, the outcome in terms of Tory majority of 42 is very similar.
The Labour losses are spread across the regions where they have significant representation, though the West Midlands seems less affected than the North. On these numbers there is no net change for Labour in the South outside of London, although the new Southampton Itchen seat looks very marginal indeed, as does Cambridge.
For the other parties, things get a bit tricky, because a small number of very close seats can – proportionately speaking – make quite a big difference. This is the case with the Lib Dems, so the figure of 6 (down 2) could well change as the proposals are revised and I do further analysis. For UKIP, Harwich and Clacton (the successor to the seat they hold) looks close, but notionally still purple. Plaid Cymru stays on three seats.
It’s important to stress that these projections all assume that the same votes had been cast in 2015. They aren’t a counterfactual of how the election actually would have played out. This has important local implications, for example when it comes to tactical voting.
The new Brighton North seat is a good example – it largely replaces the Greens‘ only seat at Brighton Pavillion, and on paper the new seat is three-way Tory-held marginal, but largely because the Labour/Green opposition splits almost perfectly. But if the election had actually been held on those boundaries, tactical voting from the left would have made this unlikely.
So don’t assume that notional results plus swing give you the outcome – as is so often the case, it’s more complicated than it looks.
Finally the skew, which moves further towards the Conservatives. The boundaries are only one part of this – there are other (far more significant) factors such as Labour’s collapse in Scotland, the Tories’ reclaiming of large parts of the South from the Lib Dems, and some anti-Labour tactical voting.
But the map does matter, and on these boundaries, the Conservatives only need a lead of around 2 points over Labour to win a majority. Baring a dramatic recovery in Scotland, Labour would need to be 6 points ahead to have the same number of seats. And the 13 point lead Labour needed for a majority on the old boundaries is now a 14 point lead. It’s not quite 2005 in reverse, but it’s not far off…
First look at the new boundaries
|
13th September 2016 |
About The Author
Related Posts
Analysis, EU referendum, Roundup
EU referendum roundup 27th April – Did Obama's intervention backfire?
27th April 2016 |
|
Analysis
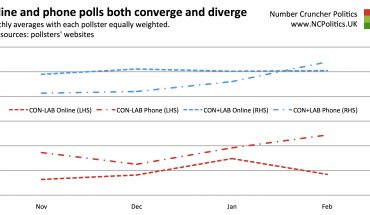
Making sense of recent polls and the divergence between phone and online polling
25th February 2015 |
|

Analysis
No, Boris Johnson Didn’t Get a Poll Boost From Catching Corona
2nd October 2020 |
|

Analysis, EU referendum
Opinium/Polling Matters polling: Is Britain going soft on Brexit?
17th December 2016 |
|