As the formal investigation into the polling failure at this year’s general election gets underway, I thought it would be useful to summarise where we stand. Additionally, this week we got two new voting intention polls, starting with ICM for the Guardian, which has updated past vote weights but no other methodological changes. This was the first poll since the election to have shown the Conservative lead narrower (albeit very slightly) than the election result. Looking at the recalled past votes, it looks as though this was a rather Labour-ish sample which, because of the way the false recall adjustment works, wasn’t entirely ironed out through the weighting. This is only a problem for polls immediately after an election, so is a minor concern, but it may explain why the result was slightly different from the other polls.
ICM/Guardian (changes vs election): CON 37 (-1) LAB 31 (=) LIB 8 (=) UKIP 13 (=) GRN 5 (+1) 12th-14th N=1,004 Tabs http://t.co/kYNBZZB5A2
— NumbrCrunchrPolitics (@NCPoliticsUK) June 15, 2015
We also got Ipsos MORI’s first offering, which has an updated turnout filter, including those “9/10” certain to vote (alongside 10/10) but excluding those that don’t normally vote. At this stage, the impact of the change seems pretty small (about a point on the lead). The toplines in this poll for the Evening Standard showed a 9-point Tory lead:
Ipsos MORI/Evening Standard: CON 39 (+1) LAB 30 (-1) LIB 9 (+1) UKIP 8 (-5) GRN 6 (+2) 14th-16th June N=1,005 Tabs https://t.co/yDlfNnS6ze
— NumbrCrunchrPolitics (@NCPoliticsUK) June 18, 2015
Turning to the pollsters’ public comments on their election performance, a number of them have already published analysis and some have implemented changes already (though even in those cases, the work is still ongoing).
Survation suspect a late swing, based on their analysis of data from during the campaign.
ICM, who pioneered many of the post-1992 adjustments, believe their sample contained an imblance among C1 and C2 voters, who were much more Labour than usual. Because these demographics were undersampled, the demographic weighting then caused these voters to skew the entire poll. The past vote weighting and adjustment then brought the results essentially into line with other houses.
Ipsos MORI feel that very high turnouts implied by their polls was the problem. It’s normal for respondants vastly to exaggerate their likelihood to vote, but MORI’s “certain to vote” figure of 82% was consistently among the highest of all pollsters and was 16 points higher than the result, compared with the more usual 10 or so points.
(3/3) Several poss explanations (being reviewed) incl turnout & diff betw say/did. Less 'shy Tory' < 'armchair Lab'? pic.twitter.com/nJ6pCA7sTp
— Ben Marshall (@BenM_IM) May 12, 2015
ComRes also suspect differential turnout and have already introduced a revised turnout model, based on history and demographics. It seems to increase the Conservative lead by about four points and would have shown a five-point Conservative lead in the final poll.
YouGov published a new poll with unchanged methodology. But their president Peter Kellner’s initial suggestion is that it’s more a case of classic shy Tories, raising the possibility that people were reluctant to admit voting Conservative even in an anonymous online poll.
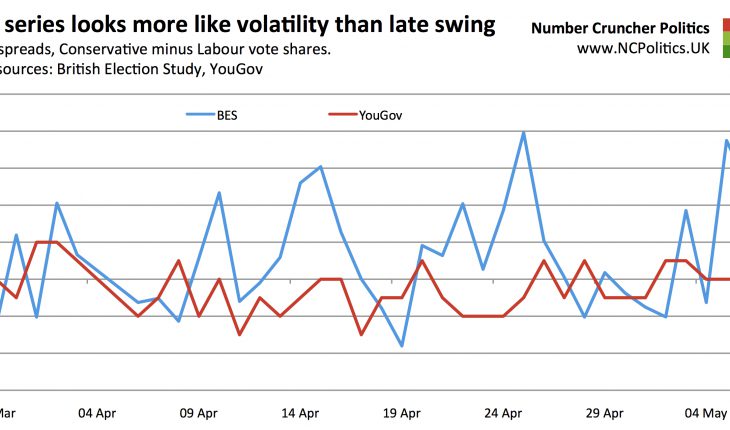
The BES, like Survation, suggested that their campaign data showed a late swing. This seemed strange because their online fieldwork is conducted by YouGov, whose published polls found no evidence of this whatsoever.

I’ve had a look at the BES data and compared it with YouGov’s polls for the Sun and the Times and found that, although there appears to have been a late swing, there were swings back and forth throughout the campaign. The BES data was considerably more volatile than the published YouGov data, much more so than can be explained by the slightly smaller sample sizes. It was also more Tory – the BES spreads fluctuated between around neck-and-neck, as the published polls showed, and about a 6-point Conservative lead, very close to the result. That it ended at the latter extreme may have been a coincidence, but the overall spread between two series suggests that the one methodological difference between them is significant – that for the BES, the “suplementary” questions are asked before the voting intention question. The theory is that this method brings panelists closer to their “polling booth” mindset.

So which is it? As several polling companies have made clear, the issues may well have been different for different pollsters. But when there is such a clear and systematic industry-wide problem, it seems improbable that there isn’t some common theme somewhere. I wouldn’t rule out any of the factors mentioned having had some impact. But the NCP prime suspect at this stage remains a classic case of the shy Tory factor: pollsters getting – for whatever reason – the “wrong” answers from the “right” people.
Evidence supporting this explanation includes the BES analysis presented above, plus the findings of James Morris of GQRR, demonstrating different answers depending on question ordering. Moreover, as I wrote previously, representative but shy/dishonest/cognitively dissonant samples would fit very well with the NCP analysis of fundamentals (such as leader satisfaction ratings) from before the election, which predicted the polling failure. It would also fit with additional private information from one or more pollsters indicating the same pattern.

It may also be relevant that other countries have recently seen similar polling biases against right-of-centre parties. Last night, Denmark’s Blue Bloc won by about three points more than polls had suggested. Israel’s Likud was underestimated in their general election by 6 or 7 points. In the US Senate elections last November the Republicans outperformed the polls, even though a majority had been expected. In Brazil‘s presidential election, Aécio Neves of the PSDB performed far better than expected in the first round (though second round polls were more accurate, as is usually the case). These countries don’t seem similar, but have experienced outwardly similar polling difficulties.
I’ll be at the BPC/MRS event this afternoon and will tweet any relevant information.