Earlier today, PoliticalBetting.com and Labrokes discussed whether we had reached “peak Corbyn”. The veteran left-winger has drifted on the exchanges from an intraday high of 22% last week to an implied probability of around 14% (about 6/1 against) at the time of writing. However, as the following analysis will show, I do not think Jeremy Corbyn has peaked, if anything this pullback is an opportunity to back him, for the simple reason that his chances are far better than the markets imply.
Have we reached Peak Corbyn? Jez's chances tick down for the first time. http://t.co/O4JRlgE69n pic.twitter.com/ufPIW6lgb1
— Ladbrokes Politics (@LadPolitics) July 20, 2015
Let’s start with the polls that Stephen Bush has been reporting in the New Statesman, one of which showed Corbyn 15 points ahead, the other showing him in a “commanding” lead. As regular readers will know, there are reasons to be skeptical of polling in general and private polling in particular, and I’ve been pretty outspoken about it myself. Leaked private polls may combine small samples with publication bias, timing bias, favourable methodology and so on. Using such biased data to try to assess the single most likely outcome (the “true” voting intention) is not recommended!
But they are useful when it comes to the bounds of probability. As this year’s general election illustarated, we don’t need to know the correct, unbiased average to know that some probabilities are wrong. For example, more than one forecast model suggested that the Conservatives had zero chance of an overall majority. Even if I hadn’t known that the polls were wrong beforehand, it would still have been obvious that the polls could be wrong enough to get the Tories over the line – they had been at least as wrong as they were this year twice (1970 and 1992) in the 12 elections since widespread polling began, or 17% of the time. You might not have put the probability of such a huge miss as high as 17%, but it clearly wasn’t zero…
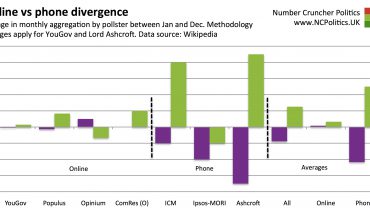
How biased are private polls? I took at the Lib Dem private polling from before the election. On average, the four polls favoured the Lib Dem candidate, relative to their principal oponent, by 16.5 points compared to the actual result. But the Lib Dems were typically overestimated by 10-11 points in published seat polls – in other words, the “bias” in this sort of private polling seems to be worth about six points. FiverThirtyEight’s database of US house races also suggests about a six-point bias towards the client. So unless Stephen Bush’s sources are supplying him with completely bogus numbers, an indicated 15-point lead is very unlikely to be a 15-point deficit, even once Corbyn’s expected disadvantage on lower-order preferences is taken into account.
Might we actually get some published polling? I certainly hope so, but the fact is that small electorate contests like this are difficult to poll, and I can’t help thinking that pollsters might view it as a poor risk/reward and at a time when they’re probably not in an adventurous mood. We can only hope…
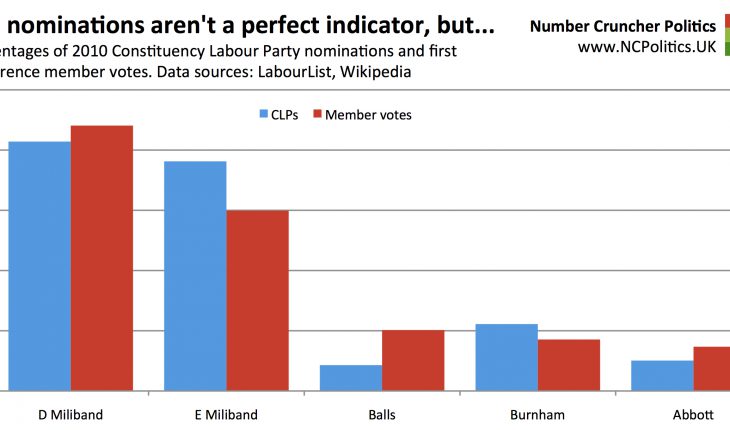
In terms of Constituency Labour Party (CLP) nominations, the current tallies show a close race between Corbyn and Andy Burnham. Labour has previously had only one contested leadership race in the last 20 years, so we only have 2010 to go on. On that occasion, the CLP figures were a pretty good guide, with an average error (of 4.3 points) that would be dire for an opinion poll, but still broadly giving the right picture of the state of the race:

Conor Pope objects that the memberships of most of the CLPs backing Corbyn now, mostly voted for David Miliband in 2010. That may reflect a CLP-versus-membership bias, but the cross-comparison could also reflect changes in party membership (such as Blairites leaving, while younger and more left-leaning members join).
Finally, and most controversially, social media. The increases in Twitter followings of the candidates since the start of July have numbered around 3,700 for Burnham, 1,800 for Cooper, 1,100 for Kendall and 7,500 for Corbyn. At the general election, social media’s politics showed itself to be wildly unrepresentative of the wider electorate and most observers have – quite rightly – taken note. But party leader elections and general elections are very different. The people that decide general elections fall entirely within the 99% of the electorate that doesn’t belong to any political party. This race, by contrast, will be decided entirely by members of the Labour Party. So while it’s highly likely that there are loud lefties and shy Kendallites, we shouldn’t simply assume that Twitter is the misleading indicator that it is in “normal” elections.
Thus the limited information in the public domain does seem to suggest that Corbyn is very much in the race. And while it clearly comes with caveats, I am certainly not convinced that the private polling, CLP nominations and social media trends are the hopelessly unreliable signals that many are assuming. It’s very tough to “nowcast” the race with any great accuracy, but Corbyn could well genuinely be in the lead. My view is that his chances of winning are significantly better than the 14% that markets are pricing in.
Update (21st July): Luke Akehurst has done some in depth analysis of the nominations for LabourList, weighting them by CLP membership. His figures are for England and Wales only due to administrative changes in Scotland (though Scottish Labour membership is now disproportionately small). Here are the percentage shares:
Corbyn 36.3
Burnham 29.0
Cooper 25.1
Kendall 9.7
If these were representative of Labour members, they fit very closely with the private polling plus bias estimate above. Luke also suggests that Liz Kendall’s transfers go uniformly to Yvette Cooper, setting up a runoff between her and Corbyn. Burnham’s transfers then split evenly between the two, making for a very close race.
Since I published this piece, Corbyn has shortened to 16% (about 5/1 against) on Betfair, but still far too long.

